
Executive Summary
The 22 September 2025 publication compared India’s foreign-exchange reserves at three historical points and asked how different government periods should be assessed. The central insight was statistical: a period can show faster percentage growth while another records a larger dollar increase. The article argued against relying on only one of these measures when discussing national reserve accumulation.
Research Objectives & Scope
The study considered approximate reserve totals for 2004–05, 2013–14 and 2023–24. It also discussed foreign direct investment, trade deficits, currency intervention and other balance-of-payments factors relevant to reserves. Its political comparison was built on time-period aggregates, not a causal identification strategy.
Key Findings
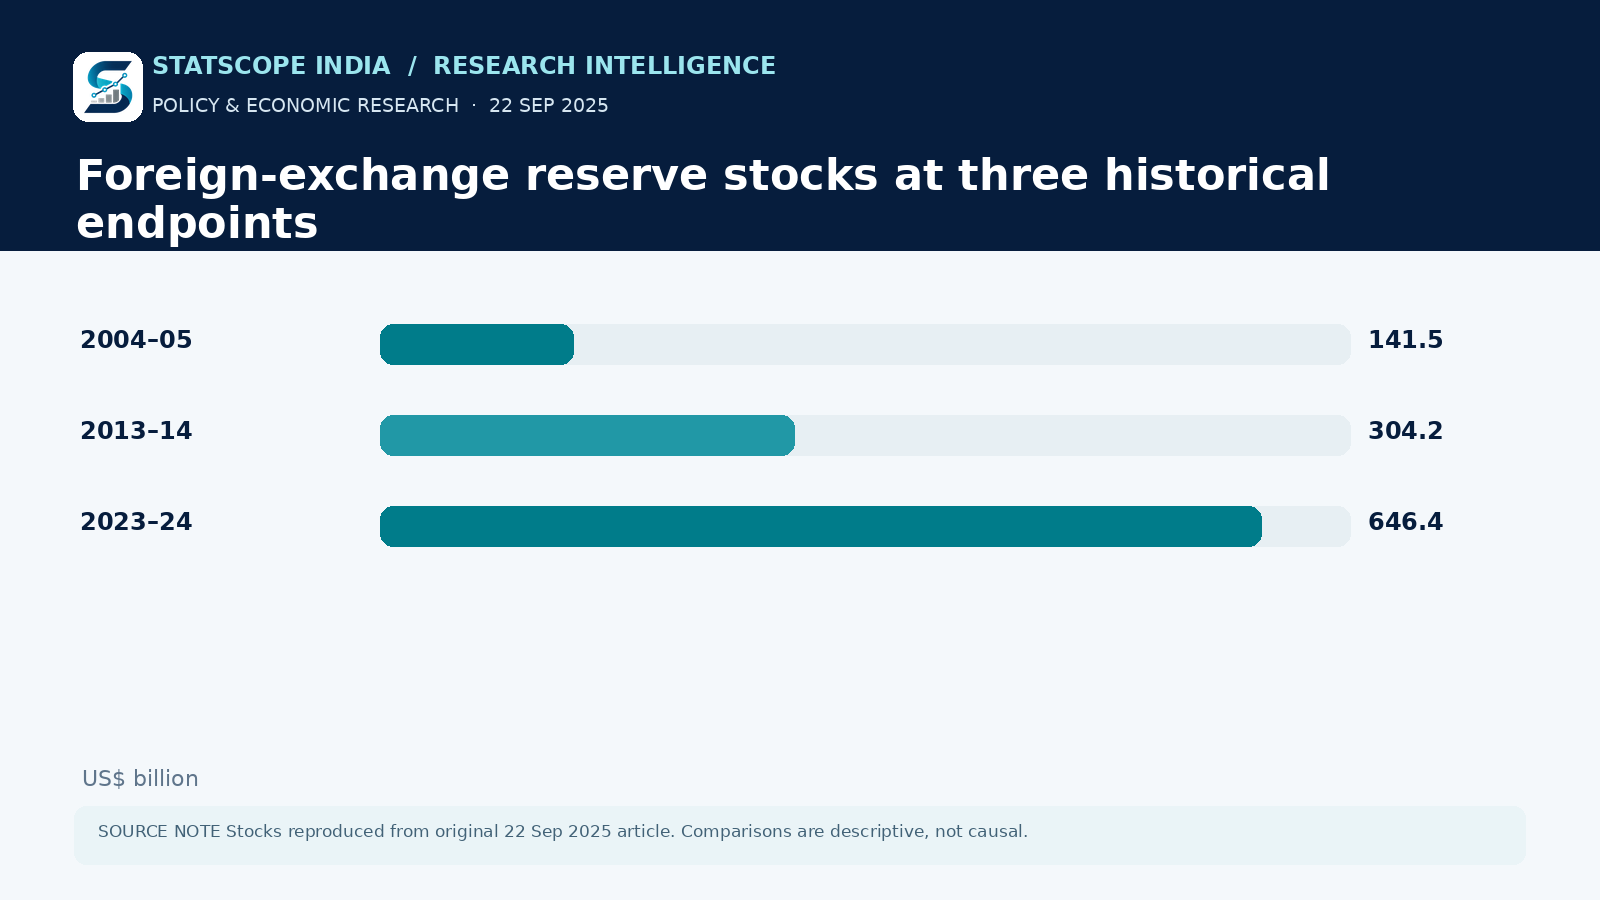
The source listed reserves of approximately US$141.5 billion in 2004–05, US$304.2 billion in 2013–14 and US$646.4 billion in 2023–24. The first interval added about US$162.7 billion, or 115%, while the next added about US$342.2 billion, or 112.5%, based on these published endpoints. This arithmetic deserves emphasis: some of the original article’s percentage and addition commentary does not exactly match the displayed endpoint values.
Research Approach
The page uses end-point comparisons and explanatory policy analysis. It does not control for global liquidity, the size of the economy, valuation changes or differences between gross FDI inflows and the balance of payments. FDI flows do not mechanically equal increases in the RBI reserve stock.
Analysis & Implications
Both rate-of-growth and absolute addition are valid descriptive statistics, but they answer different questions. Absolute growth typically increases with a larger starting base. Comparing administrations fairly also requires time-consistent reserve definitions and examination of export receipts, imports, financial flows and central-bank operations.
Outcome & Retrospective
These are historical published endpoint figures and should not be presented as India’s current reserves. The archive retains the original source and flags the derived arithmetic transparently rather than copying an internally inconsistent numerical claim.
Limitations & Interpretation
Amounts are approximate values quoted in the September 2025 publication, not independently recomputed from the RBI’s full statistical tables. The infographic labels the quantities as historical stocks.