
Executive Summary
The 4 September 2025 study extended earlier Statscope-linked GST modelling to a wider set of categories following the reform announcement. It considered how changes to tax rates could affect the retail cost of essentials and durable goods, while examining the implications for insurance, education and farm equipment. Unlike the 15 August scenario, the September analysis responded to a more concrete reform package, though price outcomes still depended on pass-through.
Research Objectives & Scope
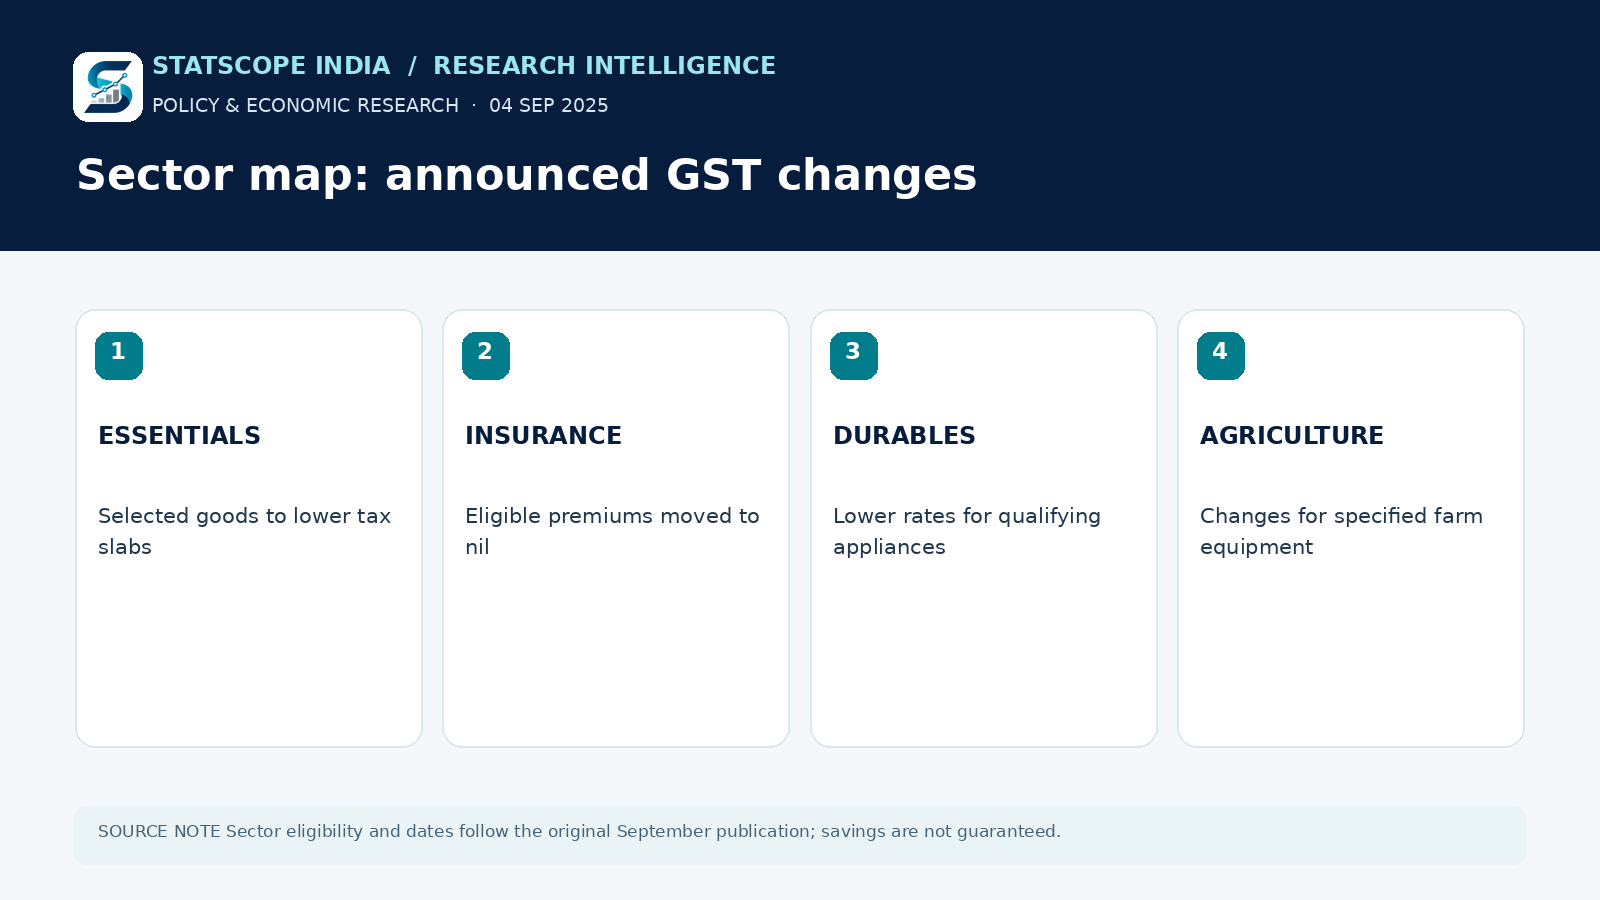
The analysis grouped products by sector and examined changes in tax rates, possible reductions in final prices and implications for suppliers. The categories covered personal care, processed foods, life and health insurance premiums, appliances, motor vehicles, school supplies and agricultural machinery.
Key Findings
The original article described a number of reductions from 18% to 5% on qualifying personal-care items and 12% to 5% for selected essentials. It discussed insurance moving from 18% to nil in the relevant category and certain appliances moving from 28% to 18%. For the same net selling price, an 18%-to-5% change produces an approximate 11.02% fall in the tax-inclusive retail price; actual prices also depend on market conditions.
Research Approach
This was a rule-and-price modelling exercise built around sectoral classifications. It could show the arithmetic implications of rate changes, but not guarantee how wholesalers, manufacturers or retailers would adjust shelf prices. Direct consumer transactions are required to establish actual pass-through.
Analysis & Implications
The cross-sector comparison points to a distributional issue: frequent purchases affect the everyday cost of living, while infrequent durable purchases may produce larger absolute savings per transaction. Insurance affordability and farm mechanisation could also be influenced by tax changes, but consumer take-up is governed by many non-tax constraints.
Outcome & Retrospective
The later Statscope scorecard dated 23 October 2025 provides a separate assessment of post-Diwali price transmission and should be linked rather than folded retrospectively into this September analysis.
Limitations & Interpretation
All illustrative savings assume unchanged pre-tax prices and correct eligibility. The graphic is a tax-rate map, not evidence of realised household savings.