
Executive Summary
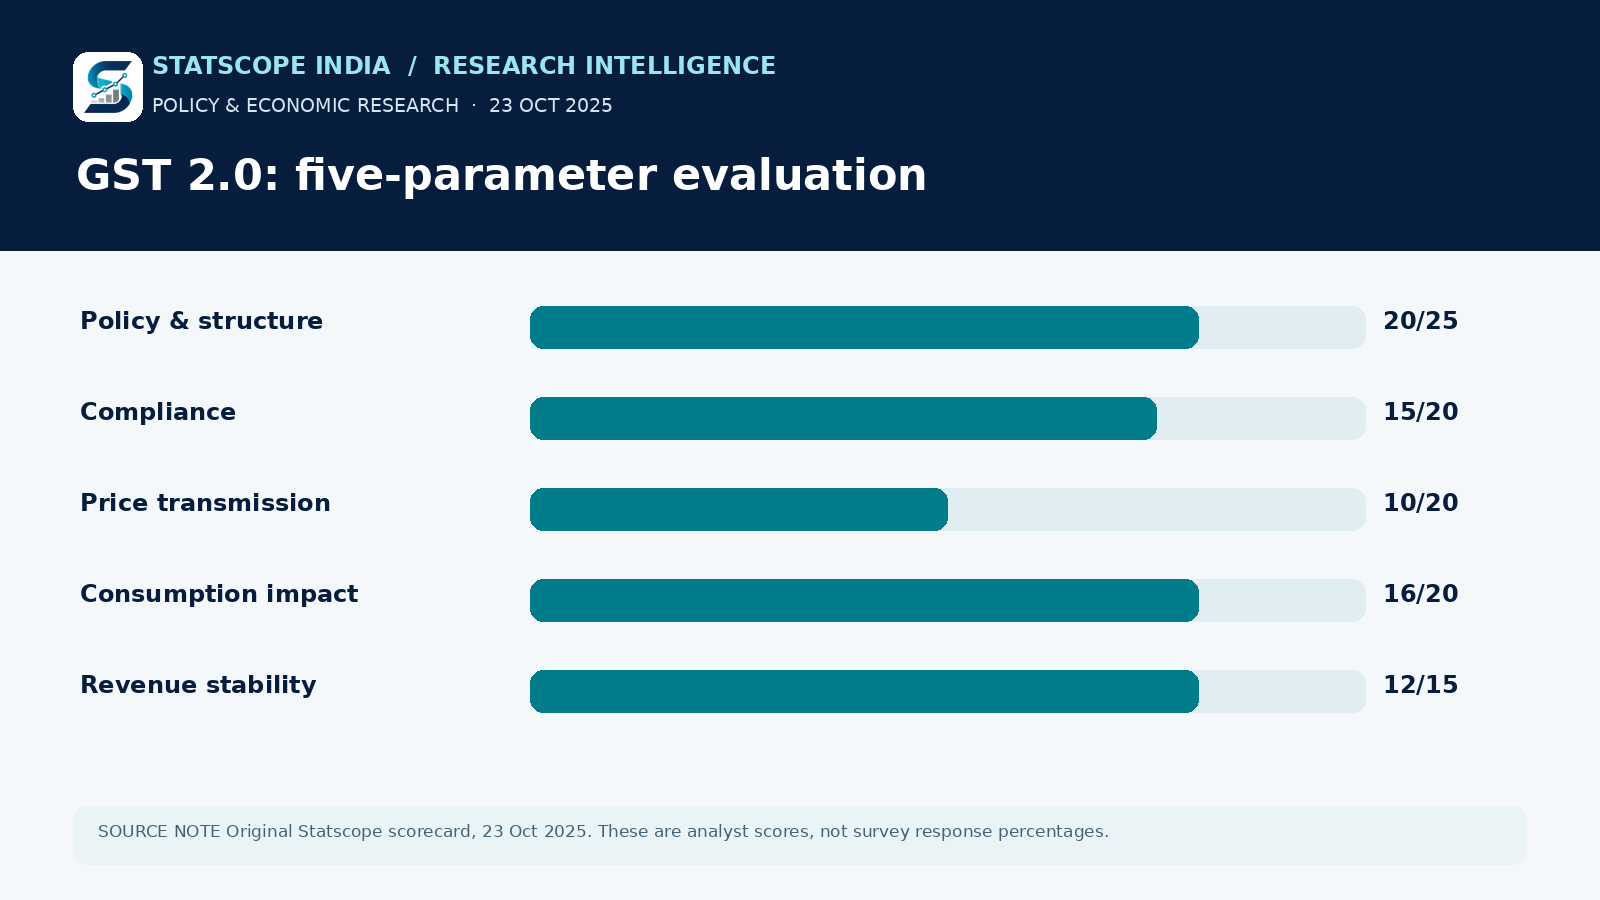
On 23 October 2025, Statscope India Research assessed the GST 2.0 programme through a five-parameter framework and published an aggregate score of 73 out of 100. The article contrasted festive-season sales momentum with concerns that savings from selected rate reductions were not yet consistently reaching household purchases. This was an analyst-constructed scorecard, not a poll reporting 73% public satisfaction.
Research Objectives & Scope
The assessment asked how the reform performed across policy design, ease of compliance, consumer price transmission, consumption activity and government-revenue stability. It was intended to distinguish the formal simplification of tax rates from economic effects as experienced in the market.
Key Findings
The original scores were: policy and structural reform 20/25, compliance 15/20, price transmission 10/20, consumption 16/20 and revenue stability 12/15. Together these add to 73/100. The weakest relative component was transmission to consumers, highlighting the distance between tax changes and observable savings at the retail counter.
Research Approach
The source combined economic observations and a weighted scoring judgement across five selected dimensions. The weights are visible, but the criteria and underlying component datasets are not sufficiently documented for independent replication. The score therefore records the authors’ research assessment rather than a statistically sampled public preference.
Analysis & Implications
The five-part design is useful because it prevents headline sales and simplified tax categories from crowding out the consumer-experience question. A follow-up could strengthen the score by establishing observable thresholds for each parameter, publishing selected product-price panels and showing how the overall figure changes under alternative weights.
Outcome & Retrospective
This was the 23 October 2025 assessment and should be linked to the earlier 15 August scenario and 4 September reform review. Those earlier pieces forecasted or interpreted changes before the festive-season evaluation.
Limitations & Interpretation
The 73/100 score is a weighted editorial research judgement, not a measurement of 73% approval or the percentage of households saving money.