
Executive Summary
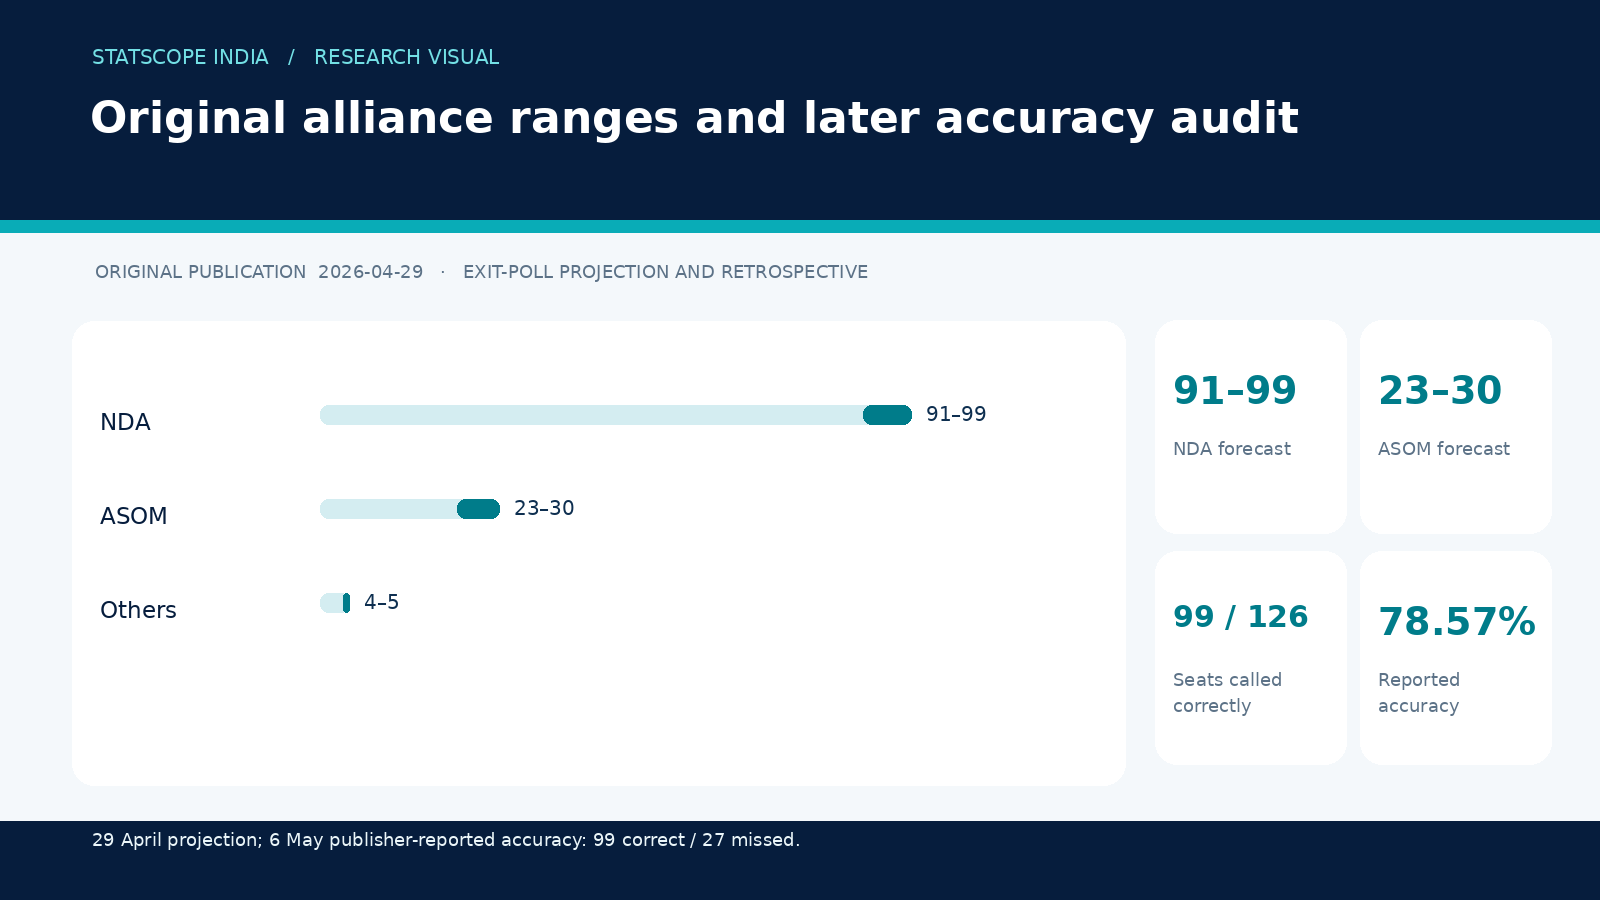
On 29 April 2026, Statscope India and Bharat Pulse News projected that the NDA would retain a decisive advantage in Assam. The published range placed the alliance between 91 and 99 of the 126 Assembly seats, against 23–30 for the ASOM opposition grouping and four to five for others. A separately published assessment on 6 May subsequently reported that the model had correctly identified the winner in 99 constituencies, or 78.57% of the total.
Research Objectives & Scope
The research sought to forecast alliance strength and the conversion of regional electoral preferences into constituency victories. In addition to the alliance call, the original article supplied party-level ranges including 72–79 for the BJP, 11–13 for AGP and eight to nine for BPF. The study aimed to distinguish a statewide NDA advantage from constituencies where the opposition could still hold ground.
Key Findings
The original publication gave the NDA a 91–99 range and a base case of 91 seats, while ASOM was placed at 23–30 and others at four or five. In the subsequent accuracy report, BPN stated that 99 of 126 seat winners were called correctly and that 27 predictions missed. These two figures form a complete reported constituency audit, but they should not be confused with the number of NDA seats won: 99 is the count of correctly forecast constituency winners across all parties.
Research Approach
The 6 May account describes field-survey inputs as one part of a wider constituency model combining earlier voting patterns, local conditions and alliance considerations. The original articles do not publish a complete respondent-level file or a replicable seat-level prediction table in the material reviewed here. Consequently the reported 78.57% strike rate remains attributed to BPN and Statscope’s own retrospective rather than independently verified.
Analysis & Implications
The retrospective argued that NDA strength in Upper and Central Assam and selected urban areas was broadly anticipated. It also identified incorrectly called seats associated with local candidate effects and tactical shifts. The lesson is not simply that an alliance can lead statewide: regional variations and particular contests can still depart from the larger pattern. The report’s own split of 99 correct and 27 incorrect seats provides a useful place to begin a future independent audit.
Outcome & Retrospective
Retrospective published 6 May 2026: BPN claimed 78.57% constituency-level accuracy, with 99 correct calls and 27 misses. The original forecast had already placed the NDA above the 64-seat majority mark at the bottom of its range. Both statements are retained with their respective dates, while a precise independent alliance-result tally is not asserted in the absence of an additional verified results table.
Limitations & Interpretation
The forecast ranges are original BPN projections, not actual seats. The correctness rate is a publisher-reported self-assessment; constituency-level replication would require the dated prediction file and official result records. Ranges are alternative possibilities and should not be summed as if all upper bounds occurred simultaneously.