
Executive Summary
The 9 November 2025 BPN publication revisited India’s 2016 demonetisation exercise through the lenses of payment formalisation, financial access and national security. Its authors presented an affirmative long-run interpretation and linked the policy to claims of disruption in counterfeit currency networks. This archive classifies the item as a historical analytical commentary, not as a new Statscope field survey.
Research Objectives & Scope
The article considered the original policy’s stated aims, the subsequent spread of electronic payments, banking inclusion and narratives about illicit finance. These are different outcome domains and require separate sources and evaluation methods.
Key Findings
The original publication argued that changes to currency circulation affected illicit networks and accelerated formalisation. It also connected the demonetisation debate to later developments in digital transaction systems. The article contains strong attributions of cause and effect; the presence of a subsequent economic change alone does not establish that the 2016 currency withdrawal caused it.
Research Approach
The source is an opinion-led review using selected historic trends and policy interpretation. It does not provide a controlled counterfactual or a complete independent measurement of the proportion of counterfeit cash eliminated, the lasting effect on illicit networks or the welfare costs of the policy.
Analysis & Implications
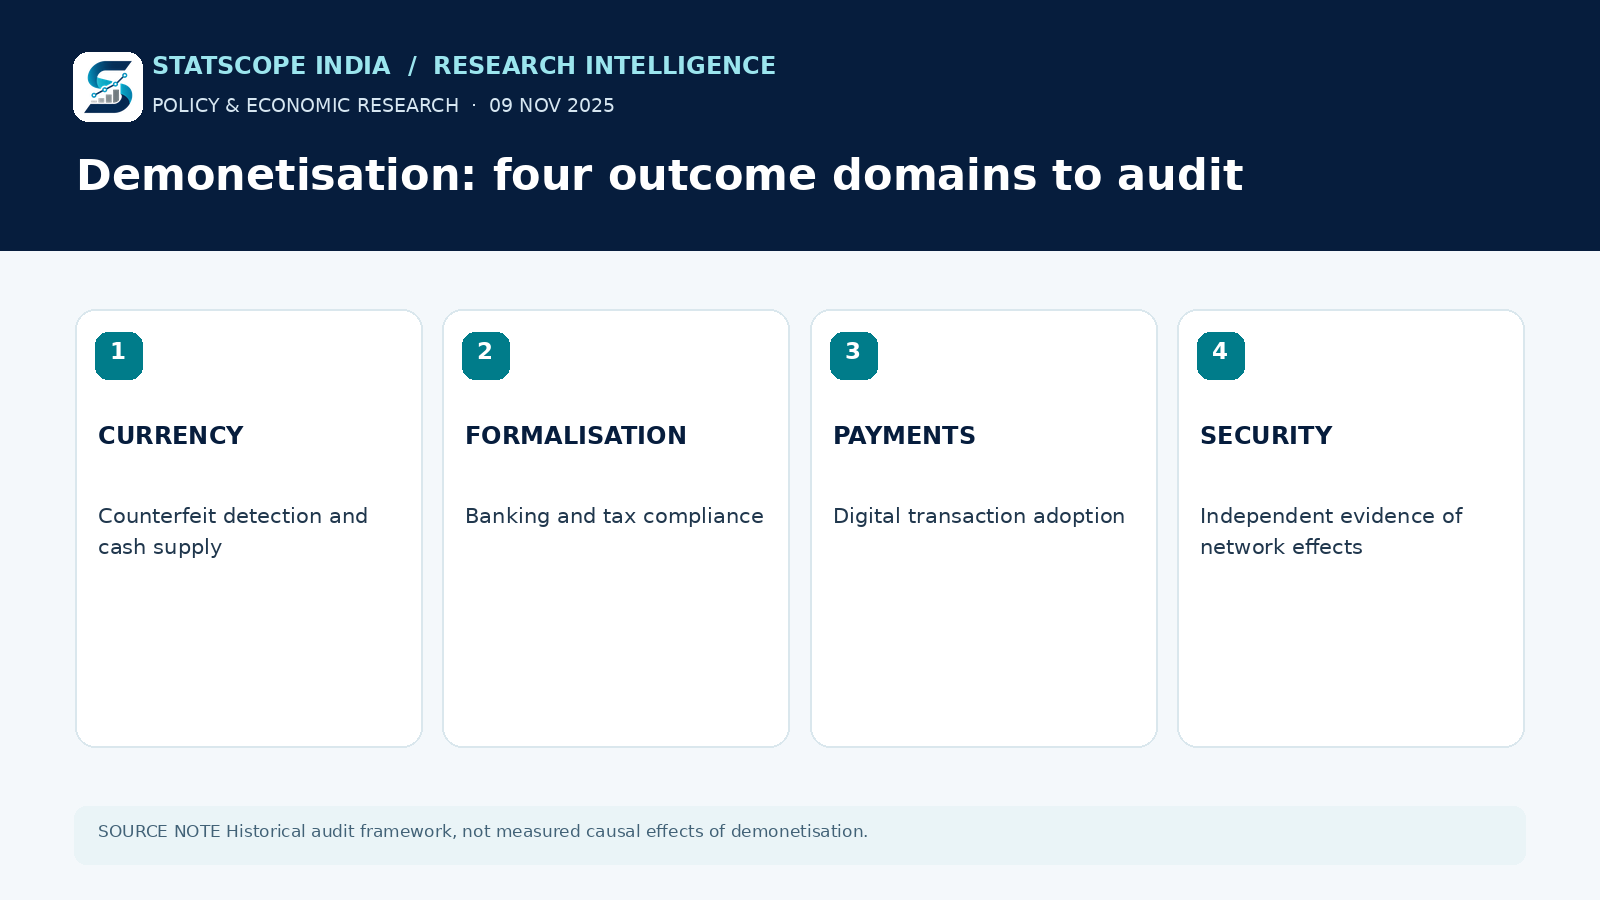
A rigorous long-horizon audit would compare the goals of the policy with multiple independently measured outcomes: counterfeit-note detection, tax compliance, cash demand, digital-payment adoption and the costs borne by households and businesses. Such an assessment should distinguish temporary disruption from durable structural change.
Outcome & Retrospective
This archive reproduces the original 2025 perspective as a documented argument. It does not certify the policy’s claimed security effects or represent the conclusions as settled econometric findings.
Limitations & Interpretation
The infographic separates four evaluation domains without attaching invented rates or causal impact figures.